Managing Marketing Budgets As Tasting Rooms Open
We’ve been waiting, and it’s finally here – tasting rooms can finally open for many of us. But 2021 began as 2020 ended, with much uncertainty as to when this significant revenue driver will open. And when they do open, how quickly will customers feel comfortable enough to visit in pre-COVID numbers?
In the meantime, eCommerce and club sales are still growing exponentially. Please don’t walk away from this new channel but continue to invest in it.
To take full advantage of all that you’ve achieved while your tasting rooms were closed, wineries should continue to use part of their tasting room marketing budgets to augment brand awareness, virtual experiences, and eCommerce marketing in the online space.

HOW MUCH?
According to a survey done by cmosurvey.org last year, most companies budget between 6.5% and 10% of their revenue to marketing, making up about 12% of their total operating budget. In June of 2020, they revisited this survey to evaluate the impact of COVID. It showed that the 8.6% average marketing had jumped to 11.4%, reflecting the focus on maintaining brand awareness and retaining customers. (This figure fluctuates between B2C and B2B and by category, with consumer marketing in the service area being the highest. Wine would fall under consumer package goods at 9.1% in the survey.)
Continue to use part of your tasting room marketing budgets to augment brand awareness, virtual experiences, and eCommerce marketing in the online space.
Ok, so if your revenue goal is $1,000,000, you should expect to spend roughly $91,000 on marketing. But this is the entire category, including headcount. Plus, companies are not consistent with what they consider marketing. So, how do we break this down?
You can find research like this CMO survey online from firms like Gartner, Forrester Research, and eMarketer, which poll various titles and industries to find averages. In general:
- Roughly 26% of budgets are allocated to technology (platforms, CRM, Mailchimp, etc.)
- 16% of budgets are spent not selling but improving customers’ experience, either virtually or in person. This is expected to increase to 20.6% in the next three years.
- Depending on the study you look at, anywhere from 26-62% of marketing budgets are dedicated to online channels, with search engine marketing (Google ads) being the largest share of that followed by social media advertising (which has increased 17% in the last five years)
- And it is noted that while it doesn’t cost a lot, email marketing is the winner of the ROI question in every study.
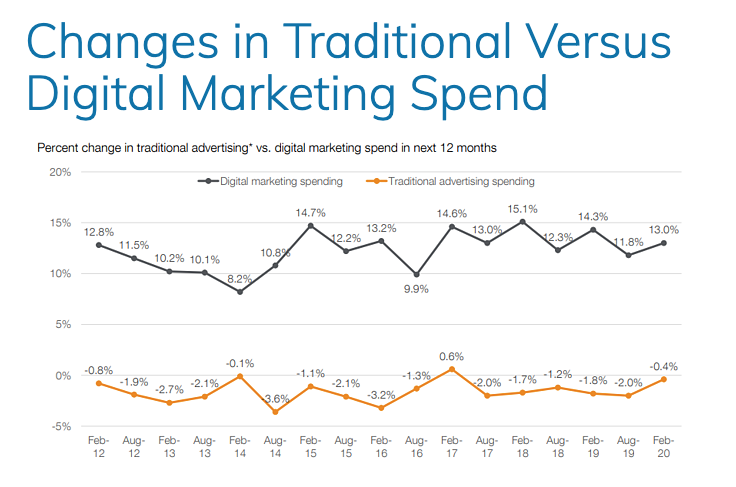
This chart, also from cmosurvey.org, shows how companies are shifting to digital growth and away from traditional (print and broadcast) channels. Since 2012, investment in conventional media has dropped by single digits, while investment in digital channels has increased by double digits.
But What About My Budget?
It takes some math to calculate how much you should spend on digital media.
- First, look broadly over your eCommerce data in Google Analytics. Look at acquisition data to understand what is working best to drive traffic to your website. If you know how to, set up a funnel to your shopping cart so you can look at what is driving sales.
- Additionally, look at platforms you might not be using, but can quickly get your boss the data to support their value online, i.e., Google Search or Display ads.
- Decide your geo-targeting and geolocation. Costs per platform vary dependent on the specificity of your targeting and geolocation – gender, age, interest, occupation, education, and geography.
- Project your return on investment based on your average click-through rate, conversion rate, and order value.
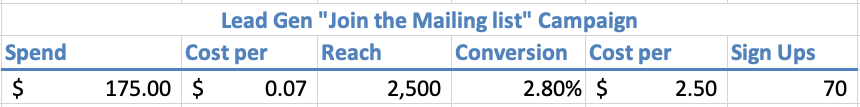
For example, we are running “sign up for the mailing list” ads on Facebook for this client. Based on our averages, we know that if we spend $175 in a month, we’ll reach out to 2500 targets and see a 2.8% conversion rate to add 70 names to the list.
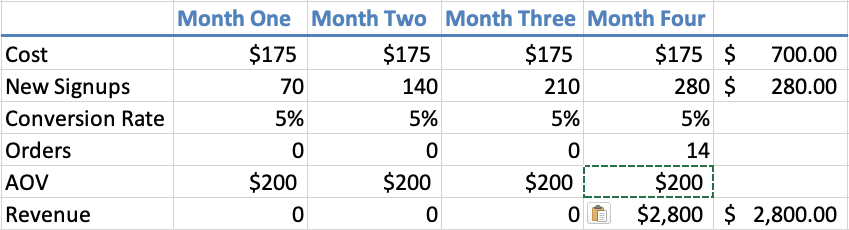
By tracking our signups, we also know that it takes about 2-4 emails and 90 days for them to buy something. We also know that our conversion rate is 5%, and our average order value is $200. We can project 14 orders by month four with a return of $2800 (and a spend of $700). Plus, over time, the list and sales should grow exponentially.
Conclusion
Whether your tasting room is open or not, the future is digital, even for those wineries with an established local customer base.
Some of the best practices of wineries successfully driving significant revenue online are:
- Lead generation focus and follow up with personalized communication.
- Analyze your data to map the customer journey for every new customer.
- Use video to get attention.
- Promote events and experiences (IRL or virtual) digitally to draw in new customers both locally and, more importantly, from broader geographic locations.
So, put your tasting room budgets and efforts to good use this spring. But don’t forget about all you’ve achieved with your digital tests over the past year. Leverage the online investment and continue to nurture all channels, regardless of your tasting room opening.